Sphyzee AnalyticsWe have the sale date and in that, we want to show the month-wise revenue in that the client wants…Step 1:2 min read·Jan 11, 2022----
Sphyzee AnalyticsWe have the Sale date and in that, we want to show the month-wise revenue in that the client wants…Step 1:2 min read·Jan 2, 2022----
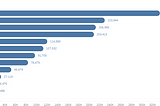
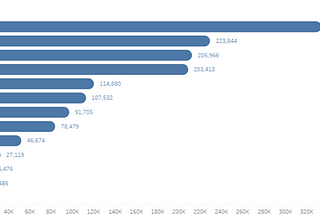
Sphyzee AnalyticsBar charts are a very basic way to represent the data.Step 1:3 min read·Dec 31, 2021----
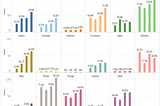
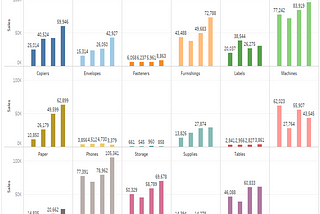
Sphyzee AnalyticsCreate a Trellis Chart in tableau using simple calculations to show a nice high-level view.Step1:3 min read·Dec 30, 2021----
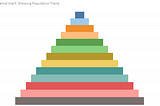
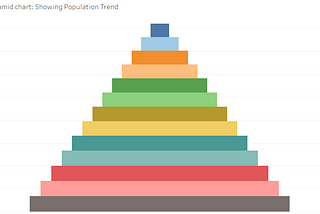
Sphyzee AnalyticsHow to create a pyramid chart using tableau desktop So what is a pyramid chart it has a triangular…Now let’s see how to create this visualization3 min read·Dec 29, 2021----
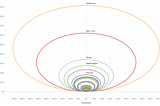
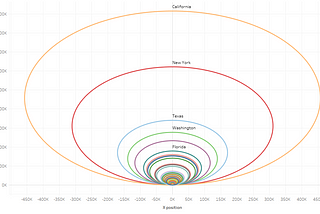
Sphyzee Analyticscreating an onion chart using tableau in case you’re wondering why it’s called an onion chart it…→Let’s learn how we can access sales across multiple states using an onion chart4 min read·Dec 28, 2021----
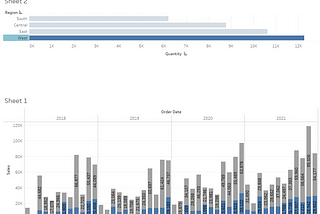
Sphyzee AnalyticsMake your legend as a slicer.Follow the Steps to Make Your Filter as Legend2 min read·Dec 20, 2021----
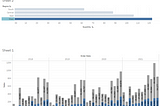
Sphyzee AnalyticsToday we’re going to be covering a new feature in Tableau that is the ability to dynamically add…STEP1:3 min read·Dec 13, 2021----
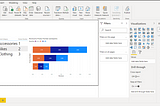
Sphyzee AnalyticsStop writing the Dax for the Conditional value use conditional function in power BIFor this we can take sales date in that the product category in that we have three elements we are going to convert That as conditional…2 min read·Dec 13, 2021----
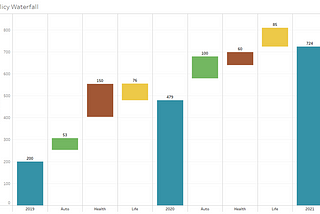
Sphyzee AnalyticsCreate a Custom Waterfall Chart using index calculation in tableau for better Data Visualization.Example4 min read·Dec 6, 2021----